
A LiveOps calendar is the schedule of events, offers, reward tracks and content drops a live game runs after launch, with a goal and a result written next to each one. Most teams keep the dates. Fewer keep the goal, the audience and the result, and those three columns are what turn the calendar into a record of which events paid back.
Below we start with the row itself, then spacing, reward calendars and holiday timing. The last part measures an event's return with a baseline and a control group, using a worked example with illustrative numbers.
What goes in each calendar row
Write one row per event before it goes live. The fields below are the ones you will need after the event ends, when someone asks whether to run it again.
| Field | What to write | Why you need it later |
|---|---|---|
| Event and type | Holiday sale, reward track, limited mode, new content | Lets you compare events of the same type across months |
| Dates and time zone | Start and end in the time zone your players use | Regional events start at different local times |
| Audience | All players, payers only, lapsed players, one region | Results only make sense for the group that saw the event |
| Goal metric | ARPDAU (average revenue per daily active user), day 7 retention, sessions per player, currency spent | One primary metric, chosen before launch |
| Rewards and prices | Currency granted, bundle prices, discounts | Shows the cost side of the return |
| Dependencies | Events before and after, price changes, app releases | Explains overlaps that distort the result |
| Owner and rollback rule | Who decides, and the number that ends the event early | Keeps a bad event from running its full length |
| Result | Lift on the goal metric, cost, verdict | The column the next plan reads first |
The goal metric matters most. A Thanksgiving event built to bring lapsed players back and a Black Friday sale built to raise spend from payers need different numbers. If the row names one metric before launch, nobody picks the flattering metric afterwards.
How to space events
Leave quiet days between events of the same type. You need those days as a baseline, and players need them too. When a sale runs every weekend, there is no normal weekend left to compare against, and payers learn to wait for the next discount.
Check three things before you add an event to the calendar.
- Overlap with paid offers. Two paid offers aimed at the same audience in the same week split the same budget. Either one looks weaker than it would alone, and the data will show only the combined effect.
- The currency balance. An event that hands out premium currency changes what players can buy for weeks afterwards. Look at how much currency players hold before you schedule a sale or a sink event, one that gives players something to spend currency on. Then the event uses up the stockpile players already have.
- Participation over time. Track the share of active players who join each event of the same type. If that share falls event after event while the rewards stay the same, the format is tiring out, and a new format will do more than a bigger reward.
Designing a reward calendar
A reward calendar is the day-by-day list of what a player earns for coming back, such as a seven-day login calendar or a reward track inside an event. Two rules cover most of the design. Give something on day 1, because a small reward on the first day shows the player how the calendar works and costs little. Then put the biggest reward on a day that needs a return visit. A large reward on day 7 gives players a reason to come back after the first few days, which is usually where the drop-off is steepest.
To check the design, chart the share of players who claim each day's reward. The day where the claim rate falls fastest is where players stop returning. Move a better reward to the day just after that drop in the next calendar, and compare the two claim curves. Also decide whether a missed day resets the streak. A reset pushes daily visits harder, and it loses more players after a single missed day.
Holiday and regional events
Holidays bring more players and more spend, and they also make measurement harder, because revenue rises in that week whatever your event did.
- Schedule in local time. A global event that starts at midnight in one time zone starts mid-afternoon in another. For regional holidays, set the start in the region's own time zone.
- Price by region. A bundle priced for one market can be too expensive in another. Test two price points in the region before the holiday, with the rest of the event unchanged.
- Pick a fair baseline. For a holiday event, the week before is a weak comparison, because holiday traffic would have raised revenue anyway. Compare against the same holiday week last year if you have it, and use a control group for any offer you push.
How to measure the ROI of an event
Event ROI compares the extra value an event created with what it cost. The extra value is the hard part, so measure it in three steps.
- Raw lift against a baseline. Compare the goal metric during the event with a baseline period, such as the same number of days before it.
- Pull-forward. Check the days after the event. Purchases that players would have made next week anyway show up as a dip after the event, and that dip comes off the lift.
- A control group for the offer. When the event includes a pushed offer, keep a random share of eligible players out of the push. The gap between the two groups is the effect of the push itself, separate from holiday traffic or anything else in the calendar.
Event ROI = (net lift in revenue − event cost) ÷ event cost
Count the event cost honestly. It includes the value of any premium currency you hand out and the art and build time. Measure revenue after store fees, and leave discounts out of the cost, since the revenue figures already reflect them.
Also look at retention for the players who joined. Players who join an event are usually already more active than those who skip it, so comparing participants with non-participants overstates the effect. Compare participants' day 7 retention with players of similar activity from an earlier period, or rely on the control group.
A worked example
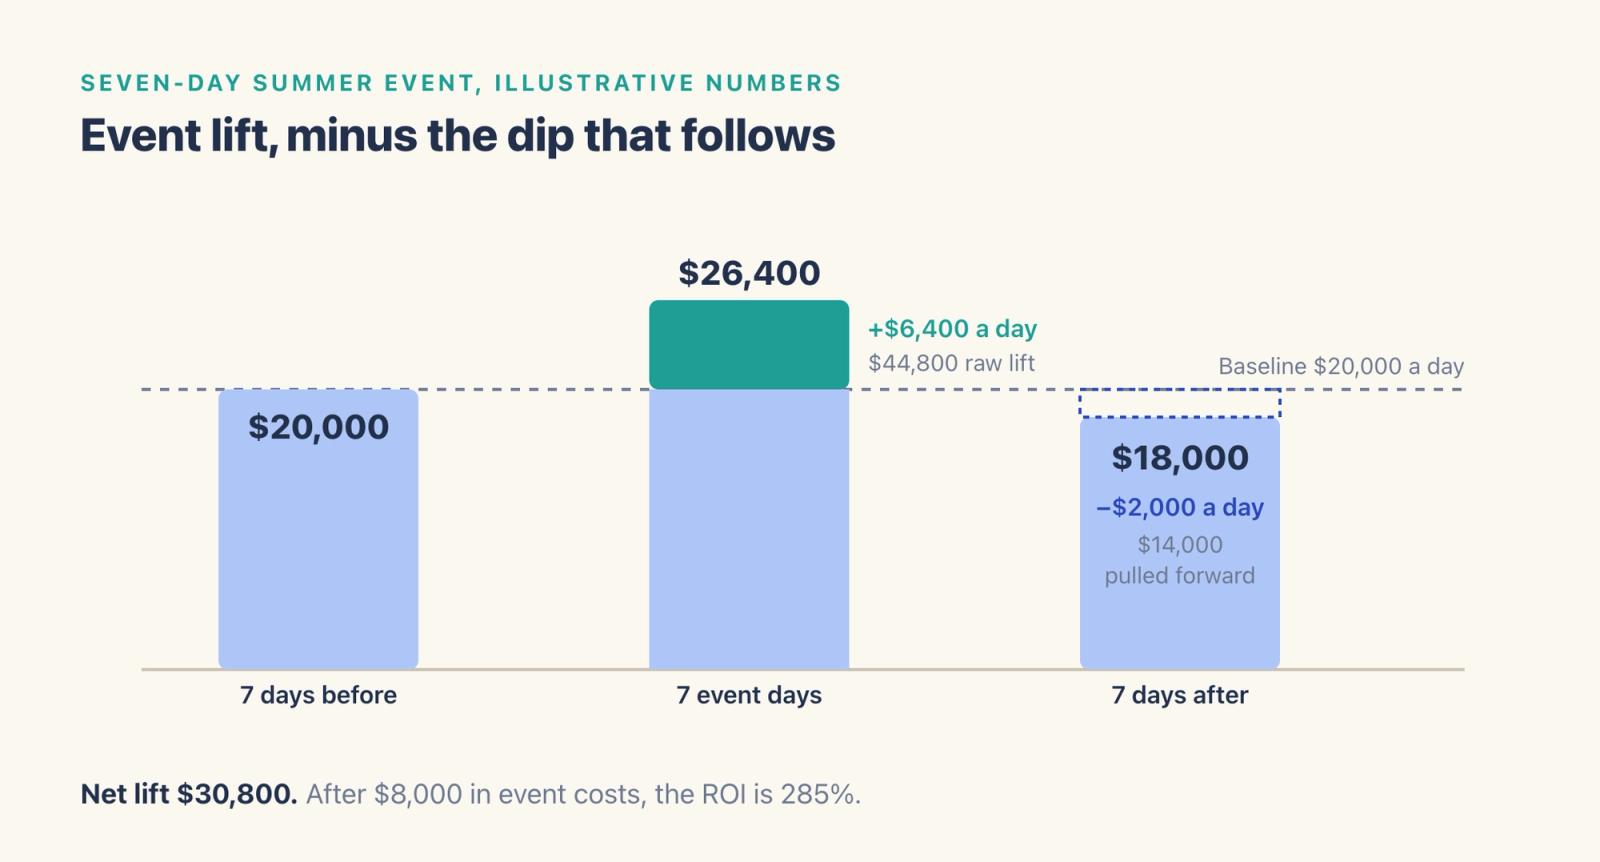
The numbers in this example are illustrative. Suppose a game with 40,000 daily active players runs a seven-day summer event, outside any holiday, with a reward track and a $10 bundle. Revenue is after store fees.
| Period | Daily active players | Revenue per day | ARPDAU |
|---|---|---|---|
| 7 days before the event | 40,000 | $20,000 | $0.50 |
| 7 event days | 44,000 | $26,400 | $0.60 |
| 7 days after the event | 40,000 | $18,000 | $0.45 |
Raw lift = 7 × ($26,400 − $20,000) = $44,800
Pull-forward = 7 × ($20,000 − $18,000) = $14,000
Net lift = $44,800 − $14,000 = $30,800
With an event cost of $8,000 for premium currency handed out and build time, event ROI = ($30,800 − $8,000) ÷ $8,000 = 285%.
The bundle was pushed to 90% of eligible players, 36,000 people, and the other 10%, 4,000 people, received no push. In the example, 4.0% of the pushed group bought the bundle, and 3.2% of the control group bought it anyway through the event screen. The push added 0.8 percentage points, which is 288 extra buyers among the 36,000 and $2,880 in bundle revenue. That is the number to use when you decide whether the push was worth sending again.
How to run it in Agentic Engine
In Agentic Engine, four steps connect the first alert to the result in the calendar row.
Spot the change. Metric alerts watch metrics such as ARPDAU or active players and send a notification when a value moves past a rule you set, for example 30% below the same period yesterday. An Automation can run an Agent on a schedule for periodic checks, such as a daily review of any event that ended the day before.
Find the cause. Break the change down by player group. A cohort of participants of a specific event lets you analyze the event's impact on retention. To see whether players hoard currency, use Distribution Analysis on each player's currency balance, the amount earned minus the amount spent. Community data from social media, game communities and live streams, with sentiment and hot topics, shows what players said about the event.
Act on it. In Engage, a campaign groups the operation tasks that share one goal, such as the bundle push and the reminder before the event ends. The schedule chart shows running tasks and campaigns as a Gantt chart by week, month or year, so the plan and what is live sit in one view. A campaign can be submitted for approval before it goes live.
Measure it. Turn on an A/B test in the operation task and set the control group to receive no push. The A/B test report compares the control group with each experiment group, and task effect analysis tracks what players did in the period after the push. Write the result into the calendar row, so the next plan starts from it.
Frequently asked questions
What is a LiveOps calendar?
A LiveOps calendar is the schedule of events, offers, reward tracks and content updates a live game runs after launch. A useful one also records each event's audience, goal metric, cost and result, so the team can compare events of the same type.
How do you design a reward calendar?
Give a small reward on day 1 so players see how the calendar works, and place the largest reward on a later day that needs a return visit, such as day 7. Then chart the claim rate for each day and move rewards toward the days where players stop returning.
How do you measure the ROI of a LiveOps event?
Take the lift in revenue during the event against a baseline period, subtract the dip in the days after the event, then subtract the event's cost and divide by that cost. For any pushed offer, use a control group that receives no push to separate the offer's effect from everything else.
How far ahead should you plan a LiveOps calendar?
Far enough to see overlaps and dependencies, which for most teams means the current month in detail and the next one in outline. Holidays and regional events need longer, because pricing and localized content take time to prepare and test.
Where to go next
For the wider picture of running a live game, see our LiveOps guide. To track revenue day by day through an event, start with ARPU, ARPPU and ARPDAU and our guide to increasing ARPDAU. To follow event participants over time, see cohort analysis for games and apps.